Contact Information
| Principal: | Brian Kelly |
| Admissions Director: | Lynda Parker; ljparker@cps.edu |
| Phone: | 773-535-1180 |
| Web site: | www.newkcp.org |
| Address: | 4445 South Drexel Blvd.,Chicago, IL 60653 |
| Freshman class size: | 124 |
| Total enrollment: | 599 (grades 9 – 12) |
Admissions
Average admissions scores at King stabilized at 658 vs. the prior year’s 655. Two years ago admissions scores at King dropped steeply — nearly 60 points from 702 to 655 as CPS for the first time used the more rigorous MAP test as the 7th grade standardized test in its admissions formula. In the prior year’s admissions cycle, average admissions scores fell evenly across all of the Tiers — each was down about 50 points.
For the past several years admissions scores for King have been the lowest in the Selective Enrollment High School family – but this year and last year King was edged out at the bottom by South Shore. For the past several years, admissions scores at King have been flat or declining, while admissions scores for other Selective Enrollment High Schools have been increasing with scores for some schools up significantly.
For the past seven years, CPS has been using a socioeconomic Tier system to select students for all of its selective admissions schools. Currently, thirty percent of seats are allocated to students with the highest academic performance citywide – regardless of their “socioeconomic status”. The remaining seventy percent are allocated to each of four socioeconomic Tiers, with each Tier receiving 17.5%. Students compete for this portion based their academic performance in comparison with other students in their Tier.
Use of the Tier system has led to significant gaps in the academic achievement required for admissions between students from different parts of the City of Chicago. There is a particularly large gap between admissions scores of Tier 4 (the highest socioeconomic Tier) and Tier 1 (the lowest socioeconomic Tier) – in the more competitive schools.
In the most recent admissions year, there was no gap between the average score of admitted King Tier 4 and Tier 1 students – and scores were relatively flat across all the Tiers. This means that admitted King students have a very similar academic background.
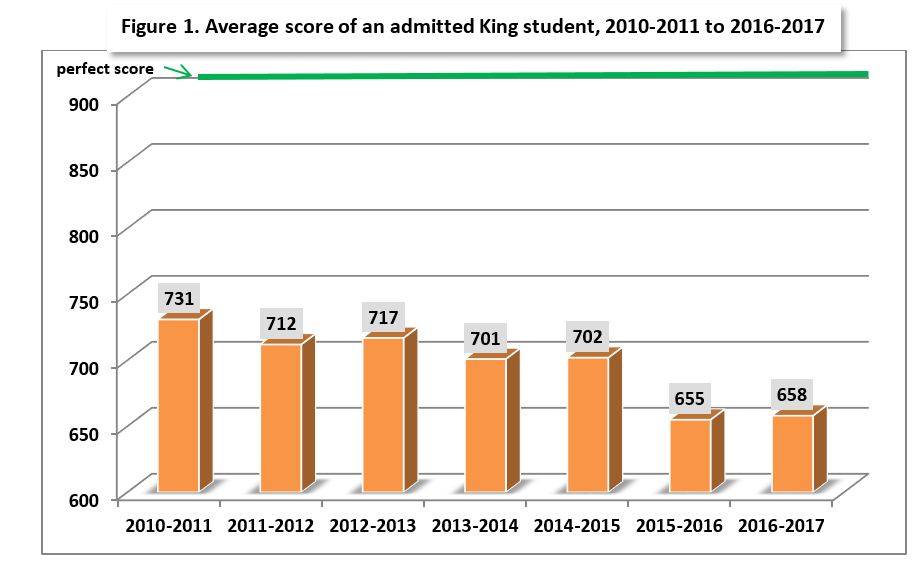
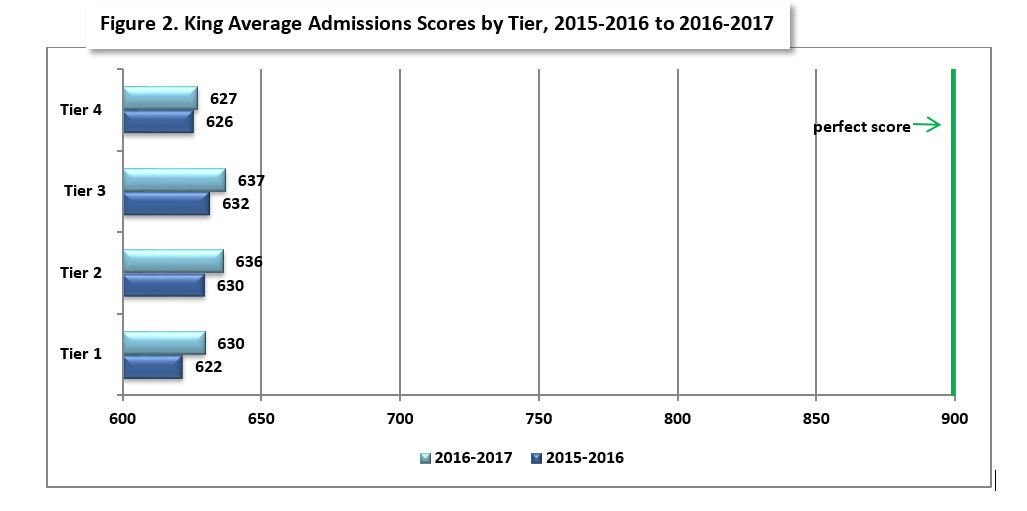
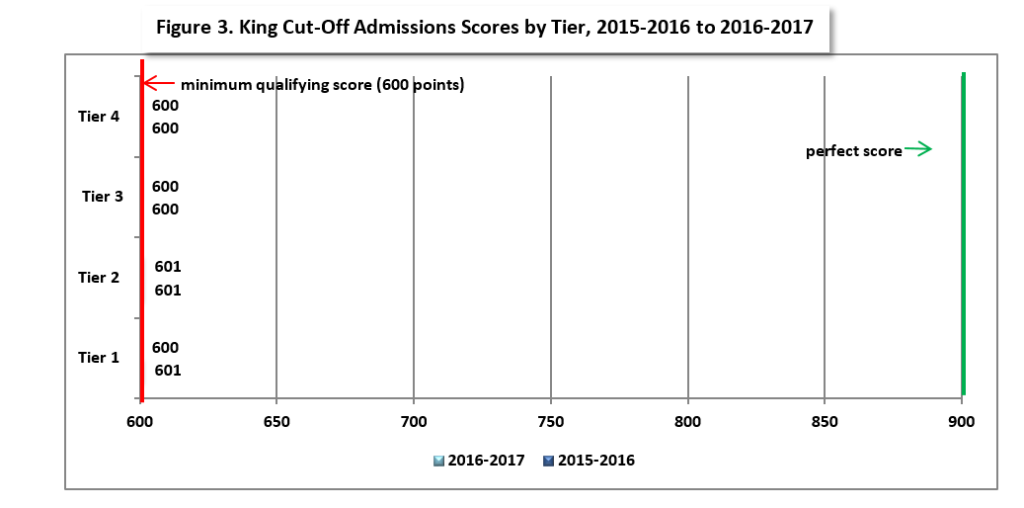
Figure 3. shows King Cut-Off Admissions scores by Tier. For the past three years cut-off scores for all Tiers have been at the “minimum qualifying score”.
Programs
King College Prep opened in the fall of 2002 with its first freshman college prep class. King College Prep’s stated goal is to prepare students for further study after high school by developing students’ intellect and citizenship. King offers a variety of Honors and Advanced Placement courses for its students. The school offers three specialty tracks: architecture and engineering, information technology, and performing and visual arts. The performing and visual arts program is perhaps the most visible component of the three. King puts on two major plays each year, and has a substantial marching band and visual arts effort.
King is one of the few Selective Enrollment High Schools that currently accepts transfer students as incoming sophomores.
In 2011, Jeffrey Wright, who was hired from Jones College Prep in 2006 (where he was an Assistant Principal), was replaced by LeeAndra Khan. Principal Khan, an alumna of Whitney Young High School, was Dean of Students at Harper High School and practiced Civil Engineering at a prominent Chicago Firm. Prior to Mr. Wright’s hiring, there had been three principals in four years at King College Prep. In fact, Jeffrey Wright is King’s first official four-year contract principal. Mr. Wright has received various honors including the Jones College Prep Advocate of the Year award, the USA Today All-USA Teacher First Team award, the 3-M Innovative Economic Educator Award and Disney’s American Teacher Award.
In 2012, a new Principal, Shontae Higginbottom took the helm at King College Prep. So far, her brief reign has been controversial. In December 2012, approximately 500 King College Prep students – a significant portion of the student body — staged a sit-in at the school to protest Ms. Higginbottom’s firing of a popular athletic coach and new rules restricting building access.
In 2013, Ms. Higginbottom was replaced by David Narrain. Mr. Narrain was previously an Assistant Principal at Kenwood Academy. Hopefully this latest change represents a move forward for King and a period of greater stability in the top leadership.
At a recent 2015 LSC meeting Principal Narrain presented statistics on King’s 2015 AP performance in relation to comparable schools. Performance on the AP Exam is graded from 1 to 5 with a 3 considered passing. Mr. Narrain stated that the percentage of students earning a 3 or better on AP Exams at King is only 18.7%. This is shockingly low for a Selective Enrollment High School. This compares to a 31.5% at Kenwood, 33.5% at Westinghouse, 63.8% at Lindblom, 64.5% at Brooks and 80.9% at Jones.
As discussed later in this profile, King students also lag in ACT performance. The vast majority of King students consistently fail on average to meet 3 of 4 ACT College Readiness Benchmarks — missing the ones for Mathematics, Science and Reading.
Mr. Narrain’s awareness of and communication about King’s lagging academic performance in comparison to its peers is a positive step in addressing this issue.
Activities/Clubs/Sports
King students participate in basketball, baseball, dance, football, golf, soccer, softball, swimming, tennis, track, volleyball, and wrestling.
Academics
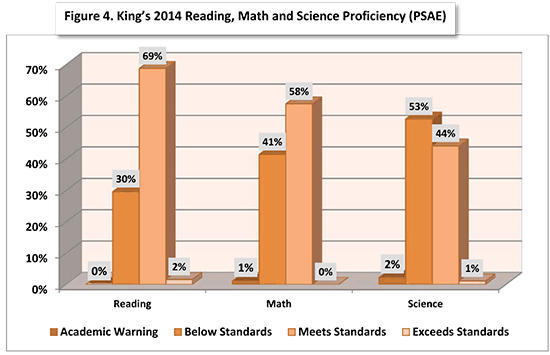
Reading, Math and Science Proficiency (Prairie State Achievement Exam), 2014
The performance of 11th graders on the PSAE (which includes the ACT) is used by the State of Illinois to assess reading, math, and science proficiency. In 2014, 51% of Illinois juniors met or exceeded standards in Reading and Math; while 49% met or exceeded standards in Science.
In 2014, 71% of King’s 11th graders met or exceeded standards in Reading, 58% met or exceeded standards in Math, and 45% met or exceeded standards in Science. In 204, an unusually large percent of King students (for a Selective Enrollment school) did not meet standards according the PSAE test. About 30% of King students did not reach the Reading proficiency benchmark, 42% did not meet the Math proficiency benchmark and 55% did not reach the Science proficiency benchmark. Moreover, only a tiny percent of King students exceeded standards in any of these categories – only 2% in Reading, 0% in Math, and 1% in Science.
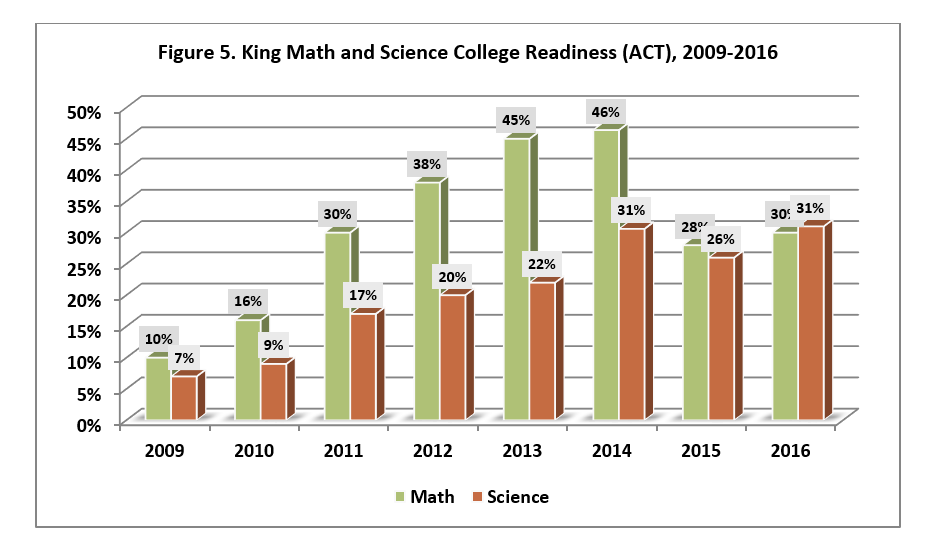
Despite King’s disappointing 2014 performance in meeting and exceeding PSAE performance standards, recent ACT scores represent an improvement over those posted in prior years – particularly in Math and Science. In 2016, 30% of King students met ACT’s Mathematics College Readiness Benchmark (vs. 10% in 2009), and 31% of King students met ACT’s Science College Readiness Standard (vs. 7% in 2009).
The ACT is the most widely used college admissions test, so its scores provide a useful guide for comparing high school academic performance. The test contains four sections: English, Mathematics, Reading, and Science. In addition students receive a composite score which is the average of these sections. The score of any of these sections and the composite range from 1 to 36.
Selective Enrollment High School students achieved an average composite score of 24.5 (approximately 75th percentile nationally) in 2016. This compares to King’s 2016 composite of 21.0 (approximately 56th percentile nationally) and Chicago’s 18.6 (approximately 37th percentile nationally), making King marginally above the national average and significantly above Chicago’s average.
Performance on ACT College Readiness Benchmarks, 2016
The ACT organization has defined “College Readiness Benchmark Scores” — median test scores that are predictive of student “success” in the relevant college courses. ACT defines “success” as a 50% or higher probability of earning a B or better in the corresponding college coursework.
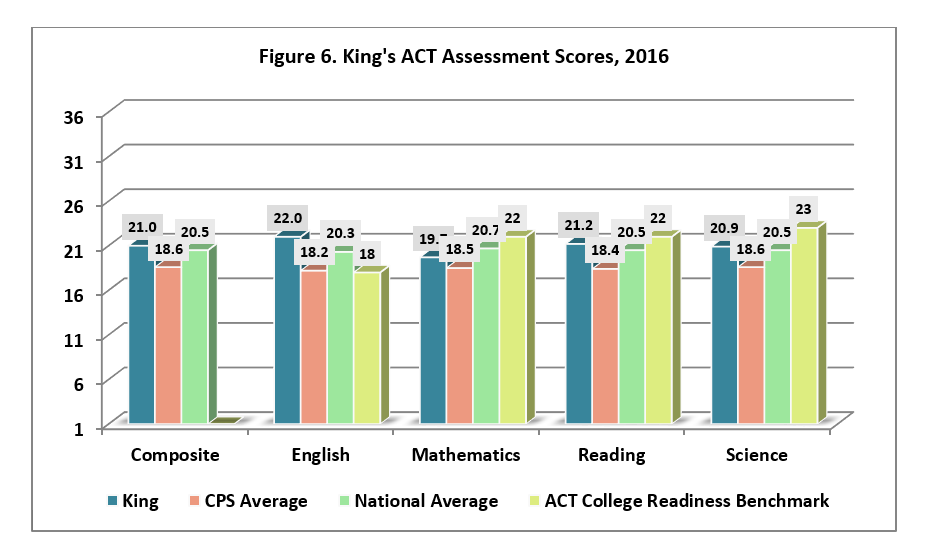
In 20156 King’s average ACT scores once again did not meet 3 of 4 of ACT’s college readiness benchmarks – leaving particularly large gaps for Math and Science. On average King students achieved the ACT College Readiness scores for English of (22.0 vs. the ACT Benchmark of 18). However on average King students missed the College Readiness Benchmark for Reading (21.2 vs. the ACT Benchmark of 22), Math (19.7 vs. the ACT Benchmark of 22) and Science (20.9 vs. the ACT Benchmark of 23).
Trends in ACT Scores
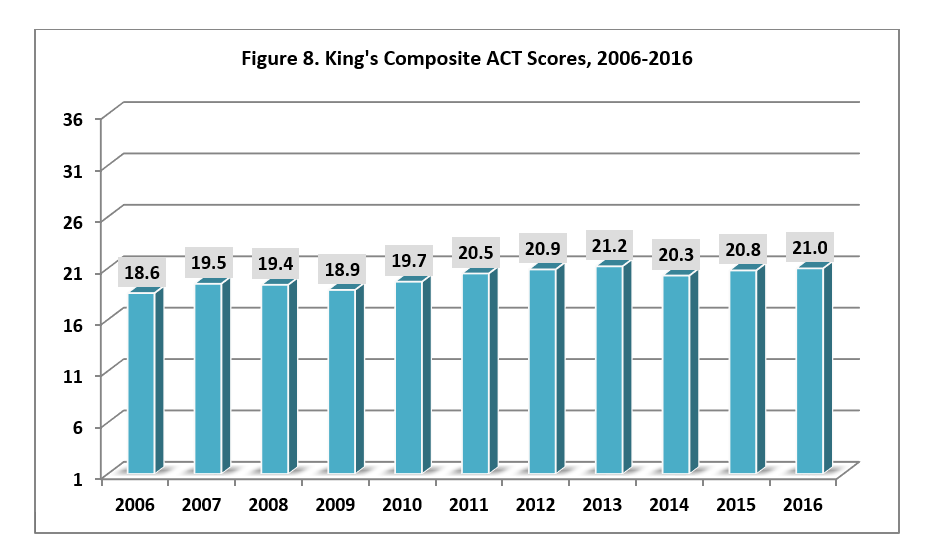
From 2006 to 2016, King’s composite ACT scores have stayed pretty flat, moving from at 19.7 (which is approximately the 48th percentile) in 2006 to 21.0 (which is approximately the 56th percentile) in 2016.
King’s 2016 State of Illinois Ranking and National Ranking
- 2016 State of Illinois Rank: 87 (US News & World Reports). In 2016, US News & World Reports ranked King 87th in the State of Illinois, dropping nearly 20 slots from 68th in the prior year. US News & World Reports uses an assessment of college readiness including performance on the ACT and AP Exams.
- 2016 National Rank: 2,151 (US News & World Reports). In 2016, US News & World Reports ranked King 2,151 in the nation, dropping nearly 500 slots from 1,681 in the prior year.
For additional academic information about King, click here for a state report card.