Lindblom Math & Science Academy
Contact Information
| Principal: | Alan Mather |
| Admissions Director: | Isais Herrera, 773-535-9305, LHerrera2@cps.edu |
| Phone: | 773-535-9300 |
| Web site: | lindblomeagles.org |
| Address: | 6130 South Wolcott Ave, Chicago, IL 60636 |
| Freshman class size: | 350 |
Admissions
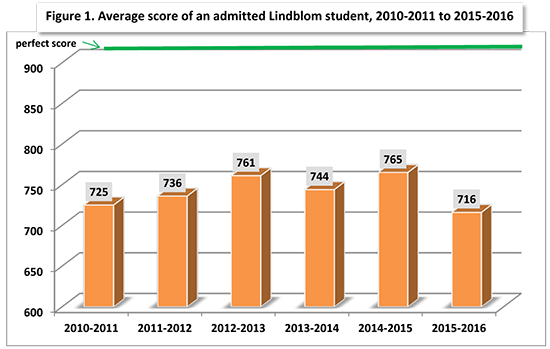
The average score at Lindblom declined 50 points in the most recent admissions cycle from 765 to 716. For the first time CPS used the tougher MAP test for the 7th grade standardized test in its admissions formula. Less competitive schools, like Lindblom were impacted the most by the use of the MAP test.
Several years ago Lindblom had the lowest overall admissions scores among the Selective Enrollment family. That is no longer the case as Lindblom is now ahead of King, South Shore, and Westinghouse.
Unlike many Selective Enrollment schools which do not consider any transfer applications for upperclassmen, Lindblom is open to accepting a limited number of qualified transfer students.
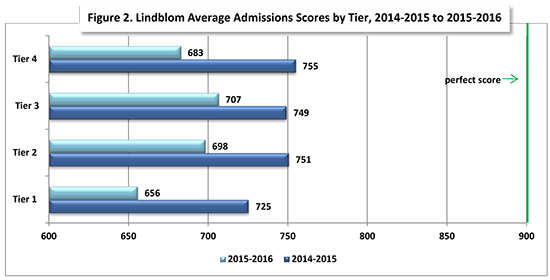
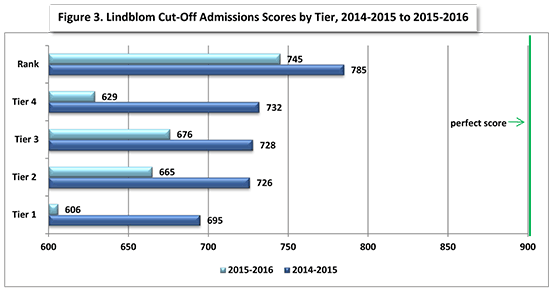
For the past six years, CPS has been using a socioeconomic Tier system to select students for all of its selective admissions schools. Currently, thirty percent of seats are allocated to students with the highest academic performance citywide – regardless of their “socioeconomic status”. The remaining seventy percent are allocated to each of four socioeconomic Tiers, with each Tier receiving 17.5%. Students compete for this portion based their academic performance in comparison with other students in their Tier.
Use of the Tier system has led to significant gaps in the academic achievement required for admissions between students from different parts of the City of Chicago. There is a particularly large gap between admissions scores of Tier 4 (the highest socioeconomic Tier) and Tier 1 (the lowest socioeconomic Tier) – in the more competitive schools.
In 2015-2016, there was a 27 point gap between the average score of an admitted Lindblom Tier 4 and Tier 1 student. Lindblom’s admissions scores are fairly flat across the various Tiers, meaning that there is not a significant difference between the academic credentials of admitted students.
Lindblom Math & Science Academy
Lindblom was re-opened in 2005 as a Selective Enrollment High School focusing on math and science. From the 1960s to 1980s, Lindblom was an attractive choice for the city’s south side students and was one of the few schools that used tests to pick its students. The school building, built in 1908 (making it one of the school system’s oldest buildings), has just undergone a massive $40 million rehabilitation. A new principal, Alan Mather, was hired in 2005 to re-establish Lindblom’s reputation. Mather came from Northside Prep, the number #1 rated high school in Illinois and another Selective Enrollment school, where he spent six years as Assistant Principal.
Lindblom offers an integrated science curriculum, Core Plus mathematics (a new applied math curriculum funded by the National Science Foundation), and a foreign language program that includes Mandarin and Arabic.
Mather has borrowed ideas from Northside including block scheduling (e.g., longer class periods that allow for more in-depth study), and offers special seminars called colloquia, where students can explore areas of interest in math and science or provide service work to the Englewood community. Colloquia include arts oriented topics (e.g., poetry, dance documentary film, etc.), service oriented work (community gardening, remedial math for the community, Headstart, etc.) and academic (codes and ciphers, computer repair, exploratory science, etc.). Each colloquium meet once a week for three hours and has no more than 20 students per session.
Unlike other Selective Enrollment schools, Lindblom operates on a year round schedule.
In 2008, Lindblom opened its Academic Center for academically advanced 7th and 8th graders. As it expands and increases its visibility, this center should provide a pipeline of talented students for Lindblom’s high school. For more information about Academic Centers, click here.
Activities/Clubs/Sports
Lindblom students can choose from baseball, basketball, bowling, cheer leading, cross country, dance, football, golf, soccer, softball, track & field, volleyball and wrestling.
Academics
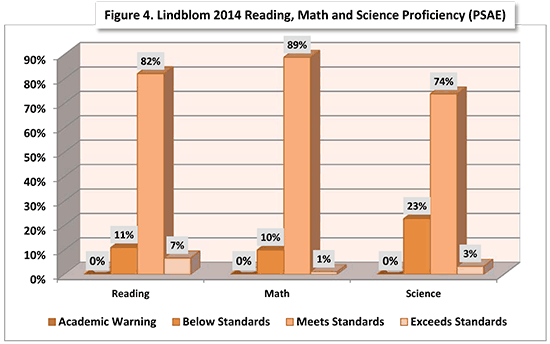
Reading, Math and Science Proficiency (The Prairie State Achievement Exam), 2014
The performance of 11th graders on the PSAE (which includes the ACT) is used by the State of Illinois to assess reading, math, and science proficiency. In 2014, 51% of Illinois juniors met or exceeded standards in Reading and Math; while 49% met or exceeded standards in Science.
In 2014, 89% of Lindblom’s 11th graders met or exceeded standards in Reading, 90% met or exceeded standards in Math, and 77% met or exceeded standards in Science. However, a relatively small percent of Lindblom’s students exceeded standards in any of these categories – only 7% in Reading, 1% in Math, and 3% in Science.
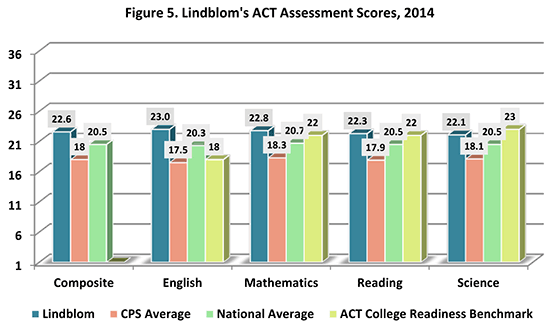
The ACT is the most widely used college admissions test, so its scores are a useful guide for comparing high school academic performance. The test contains four sections: English, Mathematics, Reading, and Science, a composite score is the average of these sections. The score of any of these sections and the composite range from 1 to 36.
Selective Enrollment High School students achieved an average composite score of 24.5 (approximately 75th percentile nationally) in 2014. This compares to Lindblom’s 2014 composite of 22.6 (approximately 65th percentile nationally) and Chicago’s 18.0 (approximately 36th percentile nationally), putting Lindblom significantly above the District (City of Chicago) average and slightly above the State of Illinois average (22.2).
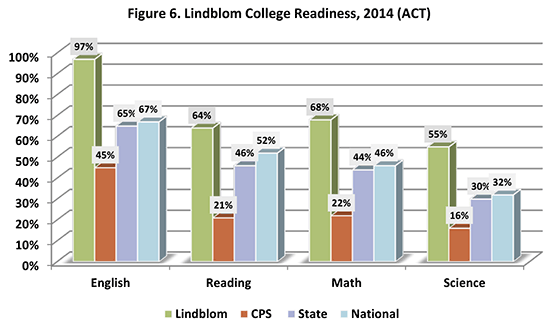
Performance on ACT College Readiness Benchmarks
The ACT organization has defined “College Readiness Benchmark Scores” — median test scores that are predictive of student “success” in the relevant college courses. ACT defines “success” as a 50% or higher probability of earning a B or better in the corresponding college coursework.
In 2014, Lindblom’s average ACT scores for English (23.0 vs. the ACT Benchmark of 18) and Math (22.8 vs. the ACT Benchmark of 22) and an average score of 22.3 (vs. the ACT Benchmark of 23) all met the ACT’s goal for college readiness. However, average scores for Science (22.1 vs. the ACT Benchmark of 23) did not meet ACT’s goals for college readiness.
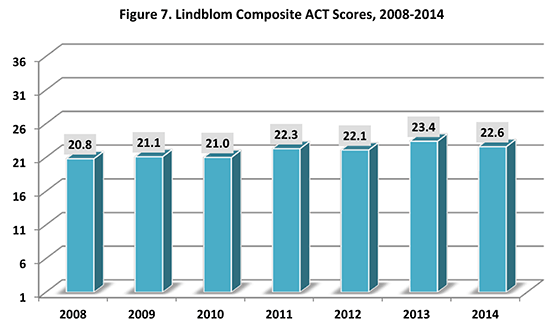
Trends in ACT Scores
From 2008 to 2014, Lindblom’s composite ACT score have moved up fairly steadily from 20.8 or approximately 55th percentile in 2008 to 22.6 or approximately 64th percentile in 2014 as shown below.
Lindblom’s 2014 State of Illinois Ranking and National Ranking
- 2014 State of Illinois Rank: (US News & World Reports): 17. In 2014, US News & World Reports ranked Lindblom 17th in the State of Illinois.
- 2014 National Rank: (US News & World Reports): 487. In 2014, US News & World Reports ranked Lindblom 487th n the nation.
Lindblom’s academic ranking in comparison with other high schools has continued to climb from a multi year perspective. Several years ago Lindblom was not even in the top 100 Illinois High Schools. Lindblom’s Principal, Alan Mather, credits his school’s decision to adapt a year round calendar, which minimizes summer learning loss, along with the extra “colloquium” and AP support programs.
For additional academic information about Lindblom, click here for a state report card.