Gwendolyn Brooks College Preparatory High School
Contact Information
| Acting Principal: | Mr. D’Andre Weaver |
| Admissions Director: | Erica Bauer, edbauer@cps.edu |
| Phone: | 773-535-9930 |
| Web site: | www.brookscollegeprep.org |
| Address: | 250 East 111th Street Chicago, IL 60628 |
| Freshman class size: | 335 |
| Total enrollment: | 745 (grades 9 – 12) |
Admissions
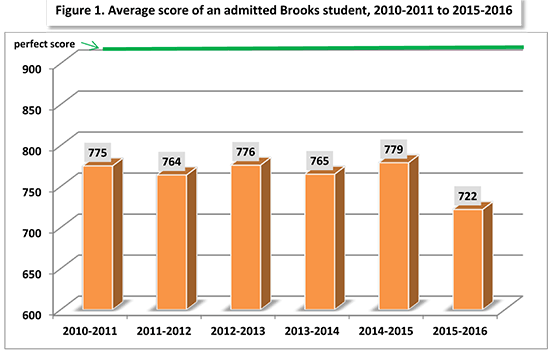
Like the average scores at other Selective Enrollment High Schools, average admissions scores at Brooks declined dramatically last year as CPS used the more rigorous MAP test as the 7th grade standardized test in its admissions formula. The average score of an admitted Brooks student fell 57 points from 779 to 722. Scores for admitted students fell fairly evenly across all of the Tiers.
Over the past 6 years Brooks admissions scores have been flat while average scores at most of the other Selective Enrollment High Schools have increased. Even though average admissions scores have not budged, Brooks is still the most competitive Selective Enrollment High School on the south side.
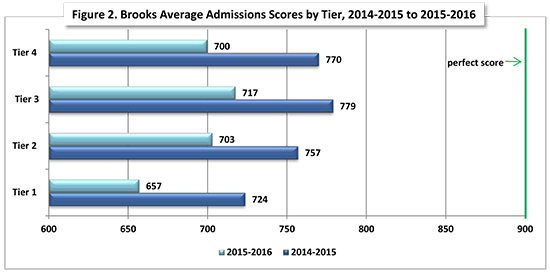
For the past six years, CPS has been using a socioeconomic Tier system to select students for all of its selective admissions schools. Currently, thirty percent of seats are allocated to students with the highest academic performance citywide – regardless of their “socioeconomic status”. The remaining seventy percent are allocated to each of four socioeconomic Tiers, with each Tier receiving 17.5%. Students compete for this portion based their academic performance in comparison with other students in their Tier.
Use of the Tier system has led to significant gaps in the academic achievement required for admissions between students from different parts of the City of Chicago. There is a particularly large gap between admissions scores of Tier 4 (the highest socioeconomic Tier) and Tier 1 (the lowest socioeconomic Tier) – in the more competitive schools.
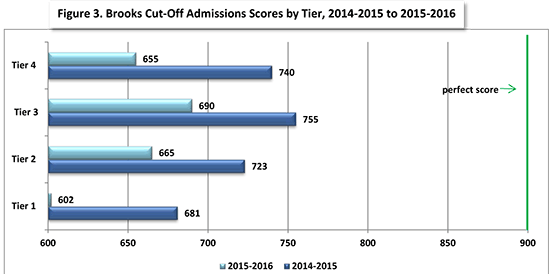
In 2015-2016 (the most recent admissions cycle), there was a 43 point gap between the average score of an admitted Brooks’ Tier 4 and Tier 1 student. This means that students living in a Tier 4 area needed to get on average 43 more points to get into Brooks than did students living in a Tier 1 area. The difference between Tier 4 and Tier 1 cut-off scores was 53 points as shown in Figure 3. The cut-off score for Tier 1 students was only 602, just above the minimum threshold of 600 points to be admitted to a Selective Enrollment High School.
Programs
Founded in 1998 as South Side College Prep, Brooks was renamed in 2001 to honor the Chicago Poet Laureate, Gwendolyn Brooks. Brooks offers a wide variety of Honors-level and Advanced Placement (AP) classes. Brooks offers AP classes in Language & Composition, Literature & Composition, Government, Human Geography, Microeconomics, Psychology, US History, Biology, Calculus (AB & BC) Environmental Science, Physics, Statistics, French, and Spanish.
Brooks even offers AP fine arts classes in Music Theory, Digital Photography, Art History, and Studio Drawing & Painting.
Brooks College Prep students participate in a variety of sports, including baseball, basketball, bowling, cross country, football, golf, soccer, softball, tennis, track and field, and volleyball.
Brooks is one of the few Selective Enrollment High Schools willing to consider transfer students.
Academics
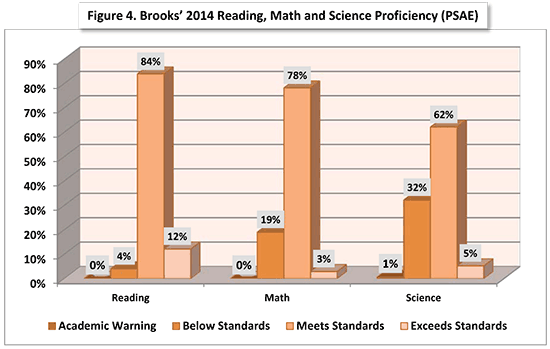
2014 Reading, Math and Science Proficiency (Prairie State Achievement Test)
The performance of 11th graders on the PSAE (which includes the ACT) is used by the State of Illinois to assess reading, math, and science proficiency. In 2014, 51% of Illinois juniors met or exceeded standards in Reading and Math; while 49% met or exceeded standards in Science.
In 2014, 96% of Brooks’ 11th graders met or exceeded standards in Reading, 81% met or exceeded standards in Math, and 66% met or exceeded standards in Science. Unfortunately there was a noticeable portion of students who were below standards in Math (19%) and Science (33%). More importantly, only a small percent of Brooks’ students exceeded standards in any of these categories – only 12% in Reading and 3% in Math and 5% in Science.
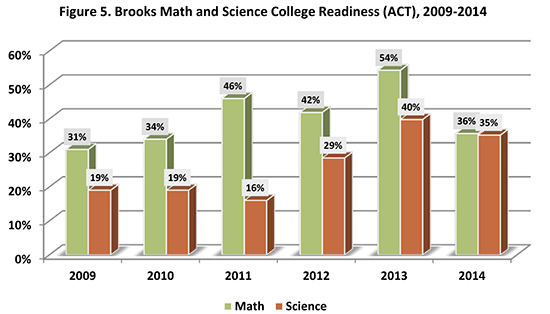
As shown in Figure 5., in 2014 only 36% of Brooks juniors met ACT’s College Readiness Benchmark in Math and only 35% met ACT’s College Readiness Benchmark in Science. Increasing scores in these areas will be important to increasing Brooks’ overall school ratings and also the competitiveness of its students in the college admissions process.
The ACT is the most widely used college admissions test, so its scores provide an important guide for comparing high school academic performance. This test contains four sections: English, Mathematics, Reading, and Science. In addition, students receive a composite score which is the average of these sections. The score of any of these sections and the composite range from 1 to 36.
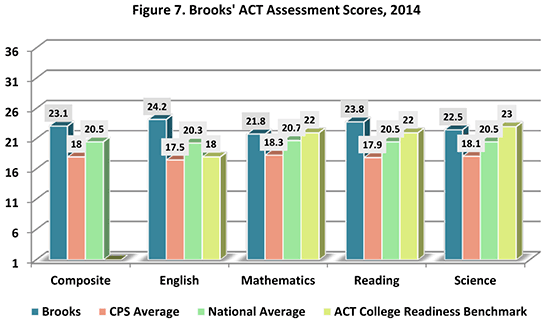
In 2014, Selective Enrollment High School students on average achieved a composite score of 24.5 (which is approximately the 75th percentile nationally). This compares to Brooks’ 2014 composite of 23.1 (approximately 68th percentile nationally) and Chicago’s 18.0 (approximately 36th percentile nationally). In 2014, Brooks’ composite ACT scores are modestly above the national average, and significantly above the District (City of Chicago) average.
Brooks Performance on ACT College Readiness Benchmarks
The ACT organization has defined “College Readiness Benchmark Scores” — median test scores that are predictive of student “success” in the relevant college courses. ACT defines “success” as a 50% or higher probability of earning a B or better in the corresponding college coursework.
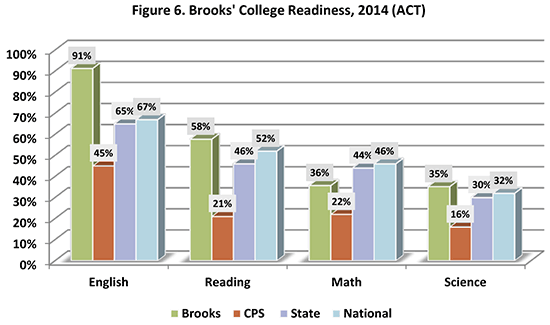
Last year, Brooks ‘average ACT scores for English (24.2 vs. the ACT Benchmark of 18) and Reading (23.8 vs. the ACT Benchmark of 22) met these goals. However, Brooks’ average ACT scores for Math (21.8 vs. the ACT Benchmark of 22) and Science (22.5 vs. the ACT Benchmark of 23) did not meet ACT’s goals for college readiness.
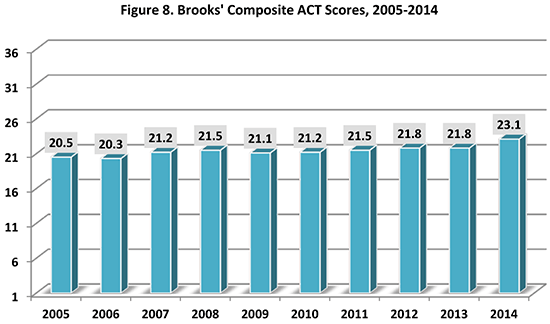
Trends in ACT Scores
Brooks’ composite ACT score has risen from 2005’s level by about 10%, but then it has remained relatively flat until last year’s increase to 23.1. Continued improvement in ACT Math and Science scores would boost Brooks’ overall academic position.
Brooks’ 2014 State of Illinois Ranking and National Ranking
- 2014 State of Illinois Rank: 16 (US News & World Reports). In 2014, US News & World Reports ranked Brooks 16th the State of Illinois. US News & World Reports uses an assessment of college readiness including performance on the ACT and AP Exams.
- 2014 National Rank: 467 (US News & World Reports). In 2014, US News & World Reports ranked Brooks 467th in the nation, based on its assessment of Brooks’ students’ college readiness in comparison to other high schools.
For additional academic information about Brooks, click here for a state report card.