Contact Information
| Principal: | Dr. Joyce Kenner |
| Admissions Director: | Augustina Bottari |
| Phone: | 773-534-7500 |
| Web site: | www.wyoung.org |
| Address: | 211 South Laflin Street, Chicago, IL 60607 |
| Freshman class size: | 350-400 |
| Total enrollment: | 1,400 (grades 9 – 12) |
Admissions
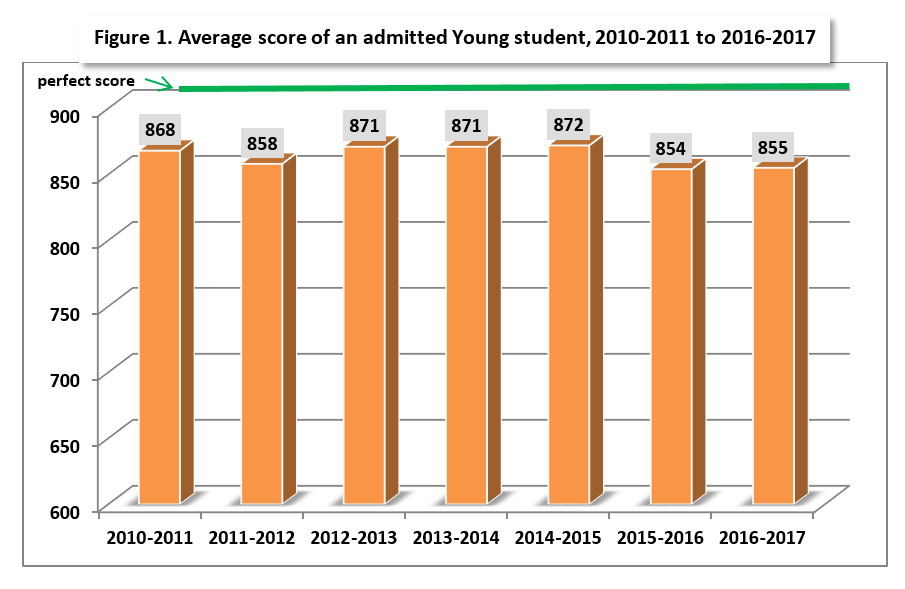
Ln the most recent admissions round (2016-2017), the average score of an admitted Whitney Young student was flat (+1 point). In the prior year, average admissions scores fell 17 points from 872 to 854, CPS used the tougher MAP test for the 7th grade standardized test in its admissions formula — triggering this decline. Scores for Tier 1 students fell most dramatically (-31 points) in comparison to a more modest decrease in Tier 4 scores (-13 points).
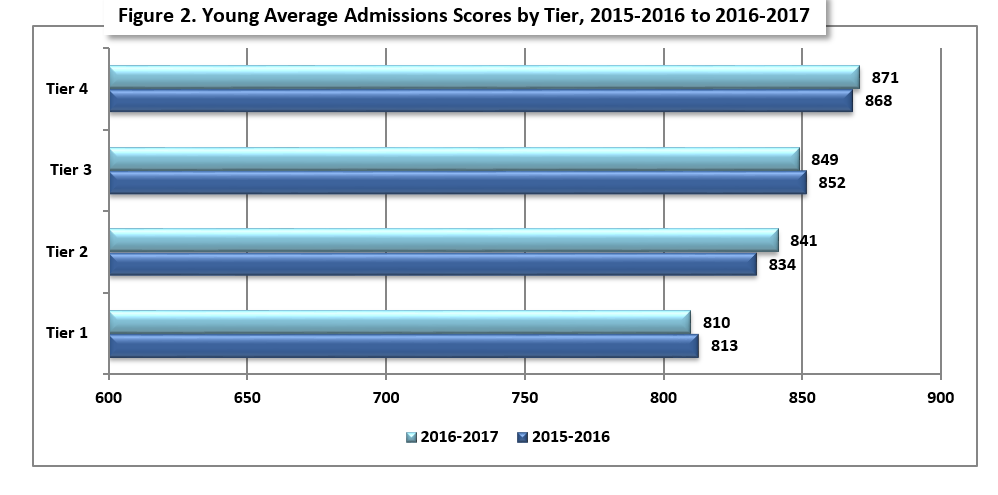
For the past seven years, CPS has been using a socioeconomic Tier system to select students for all of its selective admissions schools. Currently, thirty percent of seats are allocated to students with the highest academic performance citywide – regardless of their “socioeconomic status”. The remaining seventy percent are allocated to each of four socioeconomic Tiers, with each Tier receiving 17.5%. Students compete for this portion based their academic performance in comparison with other students in their Tier.
Use of the Tier system has led to significant gaps in the academic achievement required for admissions between students from different parts of the City of Chicago. There is a particularly large gap between admissions scores of Tier 4 (the highest socioeconomic Tier) and Tier 1 (the lowest socioeconomic Tier) – in the more competitive schools.
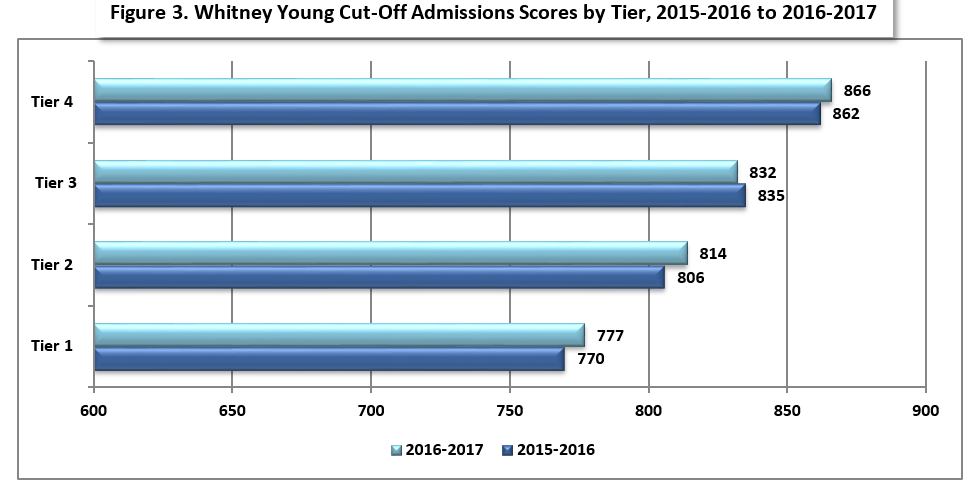
In the most recent admissions year (2016-2017), there was 61-point gap between the average score of an admitted Young Tier 4 and Tier 1 student – up from last year’s 56-point gap. There was also an 89-point gap (as shown in Figure 3) between the cut-off scores of admitted Tier 4 and Tier 1 students. The existence gaps between admissions scores of this magnitude means that students with markedly different academic levels are being accepted to a school.
Programs
Whitney Young Magnet High School opened in 1975 as a Selective Enrollment High School. Young offers 35 Honors courses and 21 Advanced Placement courses. College courses are available to students who exhaust Advanced Placement offers. Whitney Young does not rank its students since all classes are at the college preparatory level. Young has been the Illinois State Academic Decathlon Champion for 19 out of the last 20 years, and has been in the top 5 in the nation for 9 of the past 10 years.
Whitney Young offers a broad arts program including Honors Studio classes in Drawing and Painting, Mixed Media, Printmaking, Sculpture, and Video. There is an extensive music program that includes band, orchestra, chorus and piano. Dance (e.g., jazz, stage, performance, etc.) and drama are also offered. Students can take a four year drafting program that includes two years of architecture.
Whitney Young boasts Chicago’s most established Academic Center which provides accelerated programs for 7th and 8th graders along with a pipeline of top notch students for its high school. For a number of years, Whitney Young’s Academic Center has been the top rated middle school in the State of Illinois and has “graduated” over 3,300 students.
Activities/Clubs/Sports
There are over 60 Active Clubs ranging from the Adventure Club to WY Stream (the radio broadcasting club). There are about a dozen different sports including baseball, basketball, chess, cross country, football, golf, soccer, swimming, tennis, track and volleyball. Whitney Young’s sports teams have successfully competed against others in the city. Whitney Young has won numerous city sports championships including girls basketball, freshman/sophomore boys basketball, boys swimming relay, chess, cheer leading, boys indoor track and boys junior varsity tennis.
Academics
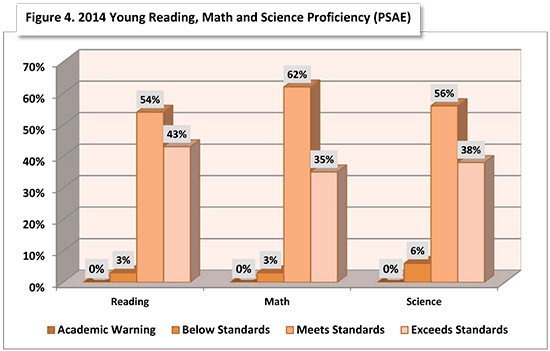
2014 Reading, Math and Science Proficiency (The Prairie State Achievement Exam)
The performance of 11th graders on the PSAE (which includes the ACT) is used by the State of Illinois to assess reading, math, and science proficiency. In 2014, 51% of Illinois juniors met or exceeded standards in Reading and Math; while 49% met or exceeded standards in Science.
In 2014, 97% of Young 11th graders met or exceeded standards in Reading, 97% met or exceeded standards in Math, and 94% met or exceeded standards in Science. In addition, a healthy percent exceeded standards in these areas – 43% in Reading, 35% in Math, and 38% in Science.
The ACT is the most widely used college admissions test, so its scores provide a useful guide for comparing high school academic performance. The test contains four sections: English, Mathematics, Reading, and Science. In addition students receive a composite score which is the average of these sections. The score of any of these sections and the composite range from 1 to 36.
Selective Enrollment High School students achieved an average composite score of 24.5 (approximately 75th percentile nationally) in 2014. This compares to Young’s 2014 composite of 26.9 (approximately 87th percentile nationally) and Chicago’s 18.0 (36th percentile nationally), putting Young significantly above both the District (City of Chicago) average and the national average.
2016 Performance on College Readiness Benchmarks
The ACT organization has defined “College Readiness Benchmark Scores” — median test scores that are predictive of student “success” in the relevant college courses. ACT defines “success” as a 50% or higher probability of earning a B or better in the corresponding college coursework.
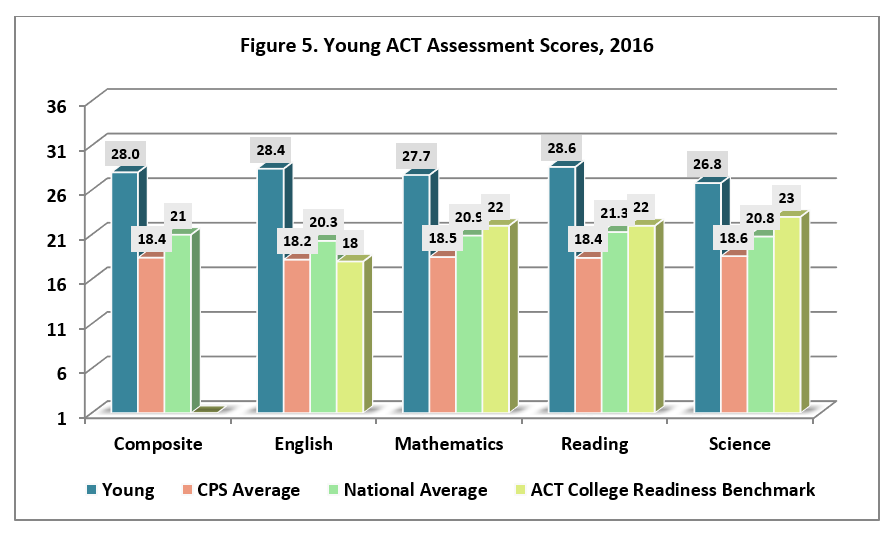
In 2016, Young’s average ACT scores exceeded all four “College Readiness Benchmark Scores” – average ACT scores for English (28.4 vs. the ACT Benchmark of 18), Reading (28.6 vs. the ACT Benchmark of 22), for Math (27.7 vs. the ACT Benchmark of 22), and Science (26.8 vs. the ACT Benchmark of 23) as shown in Figure 5.
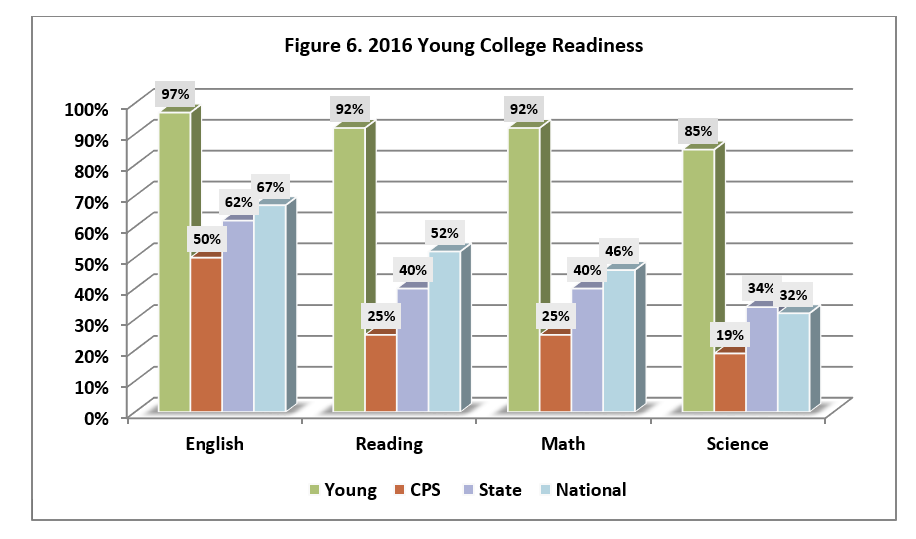
In 2016, on average 97% of Young juniors met the College Readiness Benchmark for English, 92% met the Benchmark for Reading, 92% met the Benchmark for Math and 85% met the Benchmark for Science as shown in Figure 6.
Trends in ACT Scores
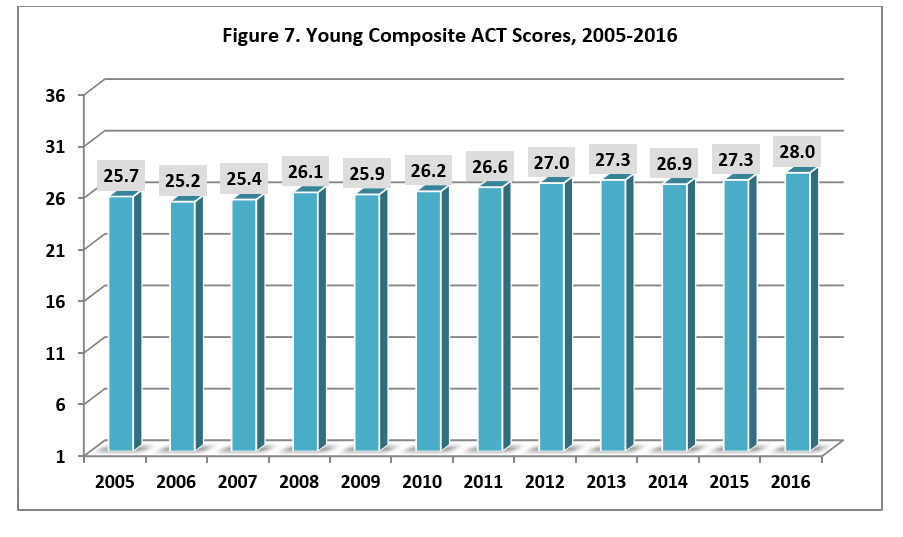
From 2005 to 2016, Young’s composite ACT score has inched up as it moved from 25.9 (approximately 83rd percentile) in 2009 to 28.0 (approximately 90th percentile) in 2016.
Young’s 2016 State of Illinois and National Ranking
- 2016 State of Illinois Rank: 4 (US News & World Reports). In 2016, US News & World Reports ranked Young 4th in the State of Illinois, behind Northside, Payton and Jones. US News & World Reports uses an assessment of college readiness including performance on the ACT and AP Exams.
- 2016 National Rank: 120 (US News & World Reports). In 2016, US News & World Reports ranked Young 120th in the nation based on its assessment of Young students’ college readiness in comparison to other high schools.
For additional academic information about Young, click here to read a state report card.