Contact Information
| Principal: | Dr. Paul Powers |
| Admissions Contact: | Ms. Therese Plunkett, Assistant Principal, teplunkett@cps.edu |
| Phone: | 773-534-8600 |
| Web site: | http://www.jonescollegeprep.org |
| Address: | 606 South State Street, Chicago, IL 60605 |
| Freshman class size: | 371 (Selective Enrollment only) plus 75 pre-law/pre-engineering |
| Total enrollment: | approximately 1,861 (grades 9 – 12) |
Admissions
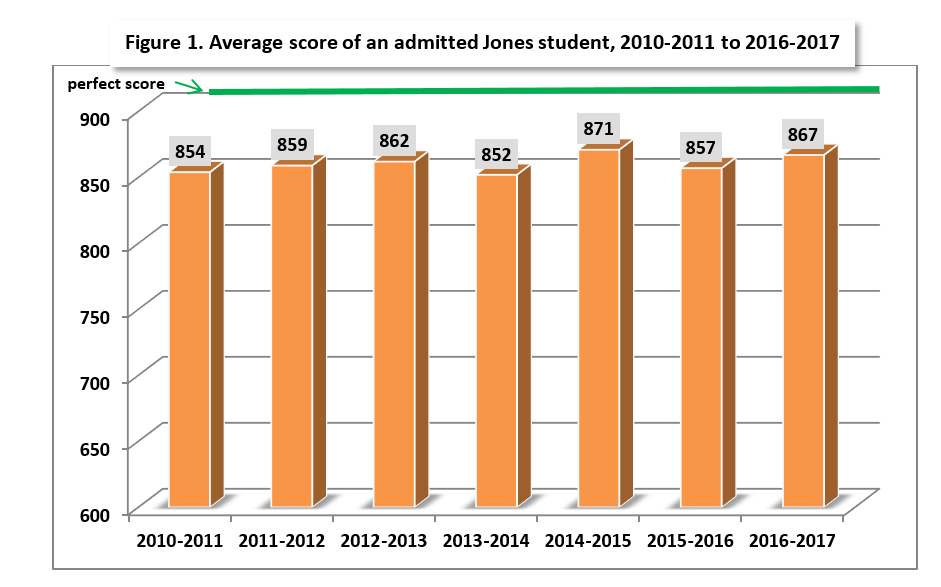
In the most recent admissions cycle (2016-2017), average admissions scores rose 10 points to 867 recovering most of ground lost last year when the average score of an admitted student decreased by 15 points from 871 to 857. This increase was led by a recovery by a recovery in Tier 1 mean scores (+30 points) to 830.
In 2015-2016 for the first time, CPS used the tougher MAP test for the 7th grade standardized test in the admissions formula. This change caused scores to decline throughout the Selective Enrollment High School “universe”. Jones’ score decline was primarily caused by a decline in the score of Tier 1 students (-37 points) while the average scores of Tier 4 and Tier 3 students fell modestly — declining 9 and 13 points respectively.
For the past seven years, CPS has been using a socioeconomic Tier system to select students for all of its selective admissions schools. Currently, thirty percent of seats are allocated to students with the highest academic performance citywide – regardless of their “socioeconomic status”. The remaining seventy percent are allocated to each of four socioeconomic Tiers, with each Tier receiving 17.5%. Students compete for this portion based their academic performance in comparison with other students in their Tier.
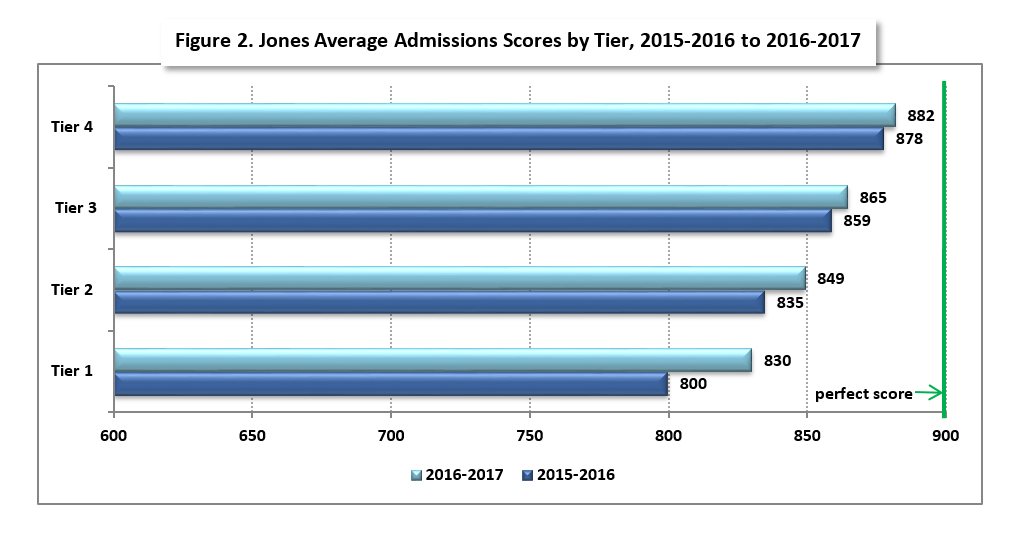
Use of the Tier system has led to significant gaps in the academic achievement required for admissions between students from different parts of the City of Chicago. There is a particularly large gap between admissions scores of Tier 4 (the highest socioeconomic Tier) and Tier 1 (the lowest socioeconomic Tier) – in the more competitive schools.
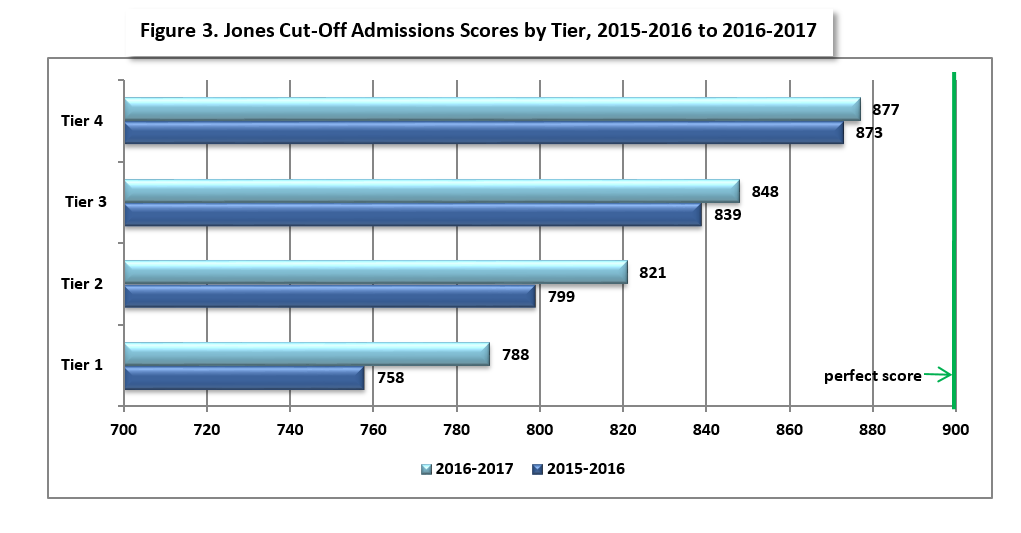
In the most recent admissions year (2016-2017), there was an 52-point gap between the average score of an admitted Jones’ Tier 4 and Tier 1 students. There was also a 89-point gap between the cut-off scores of admitted Tier 4 and Tier 1 students. The existence of large gaps between the scores of students admitted to Jones (and other competitive Selective Enrollment High Schools), means that students with dramatically different academic backgrounds are selected for the program.
In addition to students admitted citywide through the Selective Enrollment admissions process, in 2013-2014 Jones opened a CTE Program offering 75 seats in Pre-Law or Pre-Engineering Programs. Admission to these programs favors students who live within certain neighborhood boundaries. Nevertheless, students who are admitted through the CTE admissions process will however be able to enroll in non-CTE classes with other students admitted citywide under the more rigorous Selective Enrollment admissions process. For more information about Jones’ new CTE program, click here to read The Jones “Neighborhood” Option: An Opportunity Wasted.
Programs
Jones College Prep opened as Jones Academic Magnet in 1938, and then morphed into a business-focused school, first as Jones Commercial High School then as Jones Metropolitan High School of Business and Commerce. Jones College Prep, currently a member of the Chicago Public High Schools Magnet Program, became a Selective Enrollment High School in 1999. In ten short years, Jones has attracted the highest number of applicants for freshman spots of any Selective Enrollment High School. Its location makes it accessible to students across the city.
Jones’ Selective Enrollment curriculum includes the “expected” Honors and AP classes in English, Science, Math, and World Languages. In addition, Jones’ Performing and Fine Arts curriculum has a greater variety and depth than most other Selective Enrollment schools. Students can choose from Performing Arts Classes that include Honors Advanced Band (I, II, III & IV), Honors Advanced Orchestra (I, II, III & IV), AP Music Theory, Honors Jazz Band (I, II & III), Drama (I, II), Theatre Production (I,II), Honors Advanced Mixed Chorus (I, II, III & IV). Visual Arts classes include Drawing, Painting & Sculpture, Intro to Photography & Digital Media, Advanced Photo, Video & Animation, Ceramics, Drawing & Mixed Media, Honors Metalsmithing (I, II, & III), and AP Studio Art(Design & Drawing).
Jones “Pre-Engineering” Program could include courses such as Introduction to Engineering Design, Principles of Engineering, Aerospace Engineering, Biotechnical Engineering, Civil Engineering and Architecture, Computer Integrated Manufacturing, and Digital Electronics. Jones’ “Pre-Law” Program currently includes only four classes – Law in American Society, Civil & Constitutional Law, Criminal Psychology, and Academic Seminar and Legal Practicum/Leadership.
Activities/Clubs/Sports
In 2013, Jones College Prep’s $100 million dollar plus multi-year expansion was finally completed. This new space will provide Jones students with a gymnasium, swimming pool, and theater. In addition a combined media center/library will be available in the new building. The additional sports facilities should provide a boost to Jones’ sports programs since the old building did not have a gym and students had to travel several miles for sports activities. The new theater facility will provide state-of-the art lighting and sound plus seating for 500 people.
Students can choose from over 50 clubs including ethnic (e.g., African American Club, Asian Culture Club, Association of Latin American Students, German Club, Irish Club, Jewish Club, etc.), academic (Debate Team, History Fair, Math Team, National Honor Society, Science Club, etc.), civic (e.g., Close-Up Washington, Democracy Matters, Diversity Club, Eco-City Club, Student Council, etc.) and cultural (e.g., Band/Community Orchestra, Collage Art Initiative, Eagle Dance Team, Filmmakers Club, Gospel Choir, Jazz Club, Theatre Production, Writer’s Club, etc.)
Academics
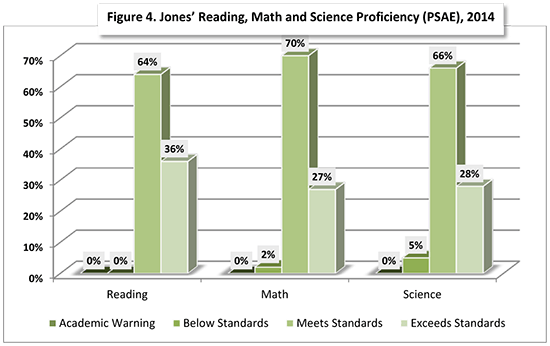
2014 Reading, Math, and Science Proficiency
The performance of 11th graders on the PSAE (which includes the ACT) is used by the State of Illinois to assess reading, math, and science proficiency. In 2014, 51% of Illinois juniors met or exceed standards in Reading and Math; while 49% met or exceeded standards in Science.
In 2014, 100% of Jones’ 11th graders met or exceeded standards in Reading, 98% met or exceeded standards in Math, and 95% met or exceeded standards in Science. In addition, a healthy percent of students exceeded standards in these categories: 36% in Reading, 27% in Math, and 28% in Science exceeded standards.
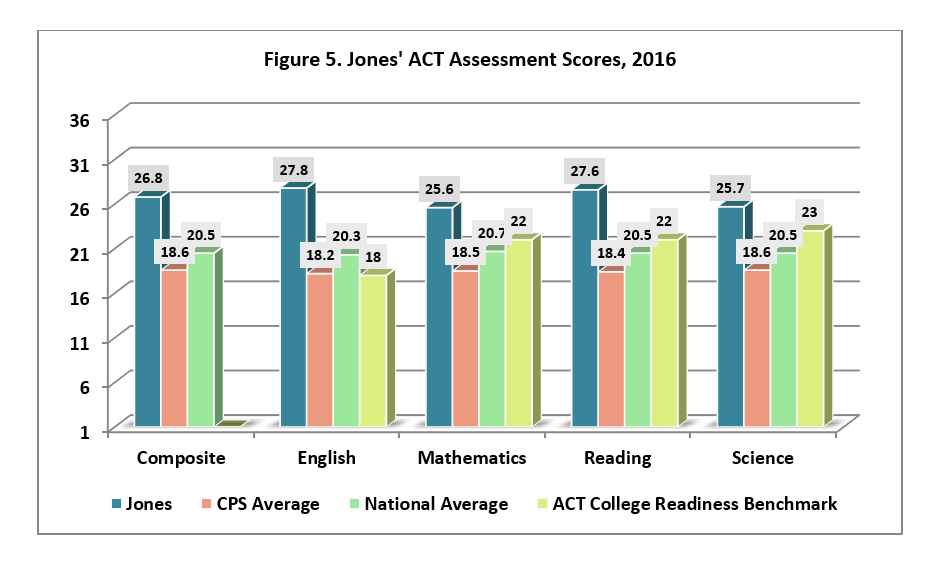
The ACT is the most widely used college admissions test, so its scores are a useful guide for comparing high school academic performance. The test contains four sections: English, Mathematics, Reading, and Science, a composite score is the average of these sections. The score of any of these sections and the composite range from 1 to 36.
Selective Enrollment High School students achieved an average composite score of 24.1 (77th percentile nationally) in 2016. This compares to Jones’ 2016 composite of 26.8 (approximately 83rd percentile nationally) and Chicago’s 18.2 (37th nationally).
Jones’ 2016 composite ACT scores are significantly above both the national and the District (City of Chicago) average.
Performance on ACT College Readiness Benchmarks
The ACT organization has defined “College Readiness Benchmark Scores” — median test scores that are predictive of student “success” in the relevant college courses. ACT defines “success” as a 50% or higher probability of earning a B or better in the corresponding college coursework.
In 2016 Jones students on average met all four of the ACT organization’s College Readiness Benchmarks. Jones’ average ACT scores for English (27.8) compares to the ACT Benchmark of 18, its 25.6 average for Math compares to the ACT Benchmark of 22, its 27.6 average for Reading compares to the Benchmark of 22,and its 25.7 average for Science exceeds the ACT Benchmark of 23.
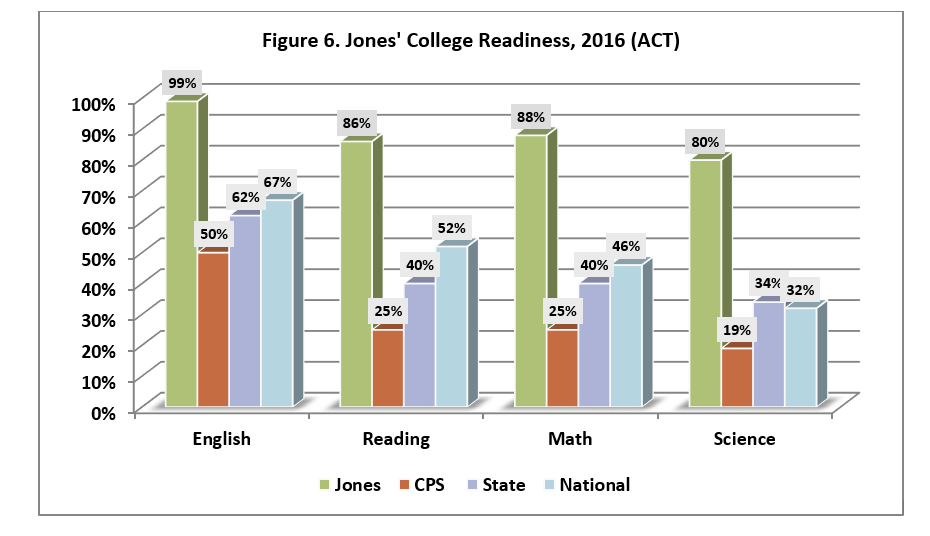
In 2016, on average 99% of Jones’ juniors were “college ready” in English, 86% in Reading, 88% in Math and 80% in Science as shown in Figure 6.
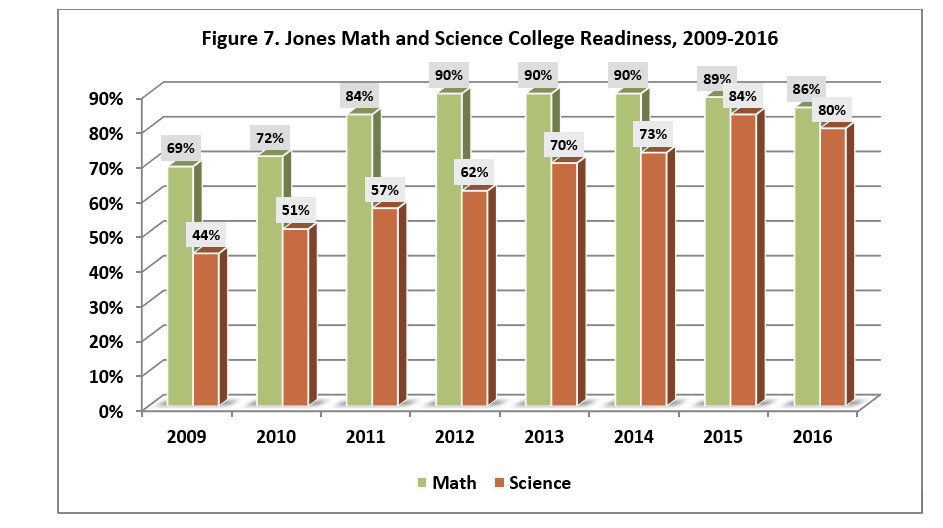
Jones’ performance in Math and Science has improved dramatically over the past 7 years. The percent of students meeting the ACT College Readiness Benchmark in Math has increased from 69% in 2009 to 88% in 2016, while the percent of students meeting the ACT College Readiness Benchmark in Science has climbed from 44% in 2009 to 80% in 2016.
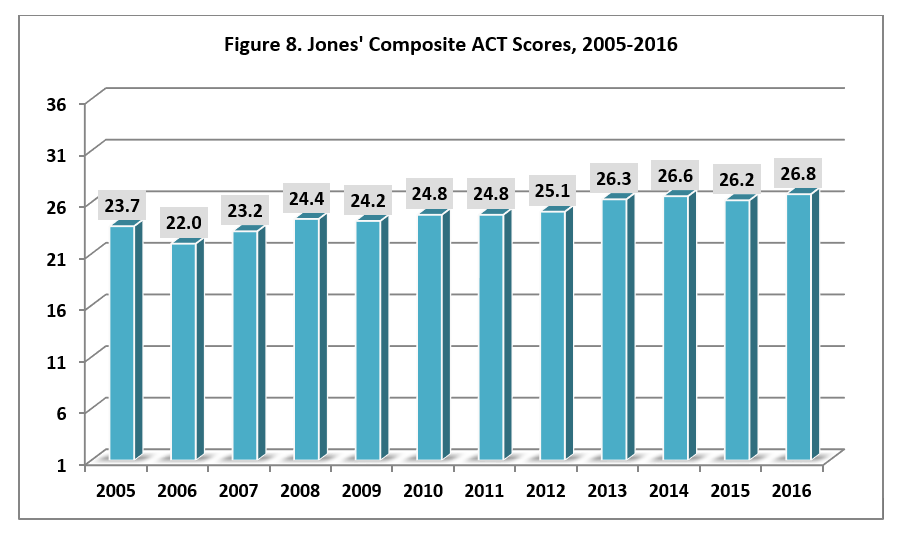
Trends in ACT Scores
From 2005 to 2016, Jones’ composite ACT score has moved up from 71st percentile in 2005 to 84th percentile in 2016 (26.8) as shown below.
Jones’ 2016 State of Illinois and National Ranking
- 2016 US News and World Reports Ranking. State of Illinois Rank: 4; National Rank: 130. In 2016 , Jones was ranked 4th in the State of Illinois, just behind Northside, Payton and Young and 130th in the country.
For additional academic information about Jones, click here for a state report card.